Is Spokane on track to attract the employers that let more people build a good life here?
More people are moving here than jobs are being created. You can feel it around town: paychecks that keep pace but do not pull ahead, and storefronts that sit empty. This resident-run page checks the numbers four times a year, and every grade links to its source.
Updated August 2026 · Next update November 2026
The answer, this quarter:
Off track
The region keeps adding people. It is not adding jobs.
Off trackmore weak than strong
Mixedweak and strong tie
On trackmore strong than weak
Eight measures: 1 strong · 4 mixed · 3 weak. One weak measure turning strong, or two turning mixed, would move the region to the middle. How the call works.
Independently maintained by one Spokane resident. No sponsors, no institutional funding, no political affiliation. Who made this.
Part 1 · The grades
Where Spokane stands, graded every quarter
The story in three numbers. If you read nothing else, read these.
1
The county lost 2,900 jobs over the past year, while the people kept coming. See the card.
2
Two sectors carry 3 in 4 new jobs since 2019. Most of the rest shrank. See the card.
3
Pay sits near the U.S. average. Incomes run at 80 cents on Washington’s dollar. See the card.
These grades measure the county and the metro, not any one institution. Who controls which levers is below. Tap a card for the comparison, the why, and the source.
What the County, Metro and City labels mean
City is Spokane proper. County is Spokane County. Metro is the county plus Stevens County. Each measure is labeled with the one it covers, because a number that is true of the metro is not automatically true of the city. Most job and wage data only exists at county or metro level, which is why the labels change from card to card.
CountyWeakAre we adding jobs?−2,900jobs, year over yearNo. Jobs are shrinking.2026 pace is 14% of the 5-year average. Tick marks the average.View details ↓Close ↑
Spokane County payrolls fell 1.1% from June 2025 to June 2026. In 2026 the metro has added an average of 58 jobs a month, the weakest pace since 2020.
5-yr average+410/mo
2025+133/mo
2026+58/mo
Average jobs added per month, Spokane metro
Show these numbers as a table
Average jobs added per month, Spokane metro
Series
Value
5-yr average
+410/mo
2025
+133/mo
2026
+58/mo
The climb stopped in 2024. Jobs in Spokane County, 2014 to 2025: average yearly employment, counted from unemployment insurance records. A decade of climbing, a dip in 2020, then the climb stops in 2024. These annual averages run through 2025. The 2,900 job drop at the top of this page is mid 2025 to mid 2026, from monthly data, and is too recent to appear here.
Show these numbers as a table
CountyWeakWho is doing the hiring?2 sectorscarry 3 in 4 new jobsMostly just two industries.Health care and logistics: 74% of net job growth since 2019. Tick marks half.View details ↓Close ↑
Since 2019, health care added 6,159 jobs and logistics 5,059, about three in four of all net new jobs between them. Manufacturing, finance, information and retail all shrank. The Workforce Council’s five-year window tells the same story: health care up 13%, finance down 12%.
Health care+13%
Finance & insurance−12%
Five-year job change by sector, Spokane County
Show these numbers as a table
Five-year job change by sector, Spokane County
Series
Value
Health care
+13%
Finance & insurance
−12%
Two sectors carried the growth. Most of the rest shrank. Jobs added and lost by sector, Spokane County, 2019 to 2025. Absolute jobs, from before the pandemic to the newest complete year, sorted by change. Two sectors carried about three in four of the net new jobs: health care and logistics. Manufacturing, finance, information and retail all shrank. Private sectors; government is all levels combined.
Show these numbers as a table
Change in average annual employment by sector, Spokane County (QCEW)
One sector keeps taking a bigger share. Health care’s share of all Spokane County jobs, 2014 to 2025. More than one in five jobs in Spokane County has been in health care and social assistance for over a decade, and the share is at its highest point now, 21.3%. This is not a new lean. It is a long one that is deepening. The share is health care jobs across all ownerships divided by all covered jobs, both from the same source.
Show these numbers as a table
Health care share of all jobs, Spokane County (QCEW)
Why it matters, and this is about the shape of an economy, not the worth of a job. Most health care serves people who already live here. Spokane is also a regional hospital hub, treating patients from Idaho and Montana, and that does bring outside money in. But the employers that lift a region’s pay are usually the ones selling to the outside world. Think manufacturing, software, professional services. Those are the ones not showing up. Local-serving work is essential and always will be; a region with no clinics or shops is not a region. The point is that something has to bring the outside money in first. Leaning on one sector is also a risk by itself. The test behind this grade is simple. Does the work bring money into the region, or just move money that is already here?
CountyMixedHow many are out of work?3.8%June 2026Few. But fewer are looking, too.86% of the U.S. rate of 4.4%. Shorter is better here.View details ↓Close ↑
Beats Washington (4.7%) and the U.S. (4.4%). But this number flatters us: it counts only people actively looking, and Spokane’s labor force participation lags the national rate, with retirements shrinking the pool faster than new workers replace it. A low rate over a shrinking base is not strength.
Spokane3.8%
U.S.4.4%
Washington4.7%
Unemployment rate, June 2026. Shorter bar is better.
Show these numbers as a table
Unemployment rate, June 2026. Shorter bar is better.
Series
Value
Spokane
3.8%
U.S.
4.4%
Washington
4.7%
Low, but it flatters. June unemployment, Spokane County, 2015 to 2026. Each point is the published June figure, the same month the headline uses. Not seasonally adjusted. Lower is better here.
Show these numbers as a table
Why it matters: this is the most quoted jobs number, so it stays on the board. The truer measure is the share of working-age adults actually holding jobs, which Spokane’s own data project tracks. That becomes this card in November.
MetroMixedDoes an hour pay enough?$32.96average hourly wageIt keeps pace. It does not pull ahead.98% of the U.S. average of $33.54.View details ↓Close ↑
Spokane wages have nearly reached the national average. But per-person income grew 4.9% in 2024 while the U.S. grew 6.6%, so the gap with the rest of the country widened again.
Spokane$32.96
U.S.$33.54
Average hourly wage, May 2025
Show these numbers as a table
Average hourly wage, May 2025
Series
Value
Spokane
$32.96
U.S.
$33.54
Pay has climbed for a decade. Average annual pay per worker, Spokane County, 2014 to 2025. Dollars are not adjusted for inflation, so part of this climb is rising prices everywhere, not raises.
Show these numbers as a table
Average annual pay per worker, Spokane County (QCEW)
Why it matters: wage level is the clearest test of employer quality. Parity with the U.S. average is real progress. Losing ground on income growth says the progress isn’t compounding.
CountyMixedWhat do we take home?$44,107per person, 2024Just under the U.S. Far under Washington.97% of the U.S. figure, and 80% of Washington's.View details ↓Close ↑
Below the U.S. ($45,256) and just 80% of Washington ($55,177), and it grew 4.9% in 2024 while the nation grew 6.6%, so the gap widened. Household income did top the U.S. median for the first time ($86,206 vs. about $81,400), but economists can’t fully explain that one-year jump and suspect federal transfer payments, so it doesn’t carry a grade on its own.
Spokane$44.1k
U.S.$45.3k
Washington$55.2k
Per-person income, 2024
Show these numbers as a table
Per-person income, 2024
Series
Value
Spokane
$44.1k
U.S.
$45.3k
Washington
$55.2k
Why it matters: income per person is the harder test. Household size and government payments cannot inflate it. In November this card adds the cleanest read on employer quality: the middle wage for people working full time, all year (Census table S2001).
CityWeakAre we spending locally?+1.2%taxable retail sales, Q4 2024Barely more than last year.27% of the long-run normal of 4 to 5%.View details ↓Close ↑
Taxable retail sales are what people spend in local stores and restaurants, as reported for sales tax. The newest county reading (Q2 2025) grew 2.8% against the state’s 3.4%, and the long-run normal is 4–5%. In the latest city-level release, Spokane grew just 1.2% while its own county grew 3.1%. County sales tax receipts have grown about 1% against a two-decade average of 4%.
City (Q4 ’24)+1.2%
County (Q2 ’25)+2.8%
State (Q2 ’25)+3.4%
Long-run norm4–5%
Taxable retail sales growth, year over year, latest reading per geography
Show these numbers as a table
Taxable retail sales growth, year over year, latest reading per geography
Series
Value
City (Q4 ’24)
+1.2%
County (Q2 ’25)
+2.8%
State (Q2 ’25)
+3.4%
Long-run norm
4–5%
Why it matters: this is where jobs and wages become street life. When spending growth in the city runs at a quarter of its historical pace, storefronts stay dark no matter what gets built.
MetroMixedAre shops full or empty?5.3%retail vacancy, Q2 2026Too many sit empty. Not improving.Spokane Valley sits at a healthier 4 to 5%, the tick. Shorter is better here.View details ↓Close ↑
Vacancy is the share of store space sitting empty. It is flat compared to a year ago. Only about 49,000 square feet of retail is being built, far below the ten-year average. Downtown lags because daytime office workers never fully came back. Spokane Valley sits at a healthy 4 to 5%.
Why it matters: developers read the same demand numbers on this page. Fill the jobs and the wages, and the storefronts follow.
A real block: the 900 block of West Garland Avenue, 2016. The marquee Spokane loves, and For Lease signs in the windows beside it. This photo is from 2016, so it is not evidence about today’s vacancy. The 5.3% figure above is. What the picture shows is the stake: these are the storefronts the whole chain ends at. Photo: Charles Burns, CC BY-SA 4.0, via Wikimedia Commons.
CountyStrongAre people moving here?~556,000county residentsYes. The one strong grade.Grew faster than Washington and the country last year. The sources report the direction, not a rate, so there is no bar to draw.View details ↓Close ↑
Spokane grew slightly faster than both the state and the country last year, and the largest age group is 25 to 34.
Why it matters: workers are choosing Spokane before the employers do. That’s the region’s strongest card, and it’s perishable. Working-age people who can’t find higher-wage work here eventually leave to find it.
People keep arriving. Employer growth isn’t keeping up.
The old story
Growth would take care of itself. People move here, employers follow, and a bigger Spokane becomes a better one.
What the numbers say now
More people only helps if jobs and pay grow with them. Right now they are not. The chain below shows where it breaks.
People556kgrowing
→
the breakEmployers−2,900jobs lost
→
Paychecks$32.96near U.S.
→
Spending+1.2%below normal
→
Storefronts5.3%vacant, flat
Break one link and the whole chain can turn the other way.
The whole machine, and the longer story
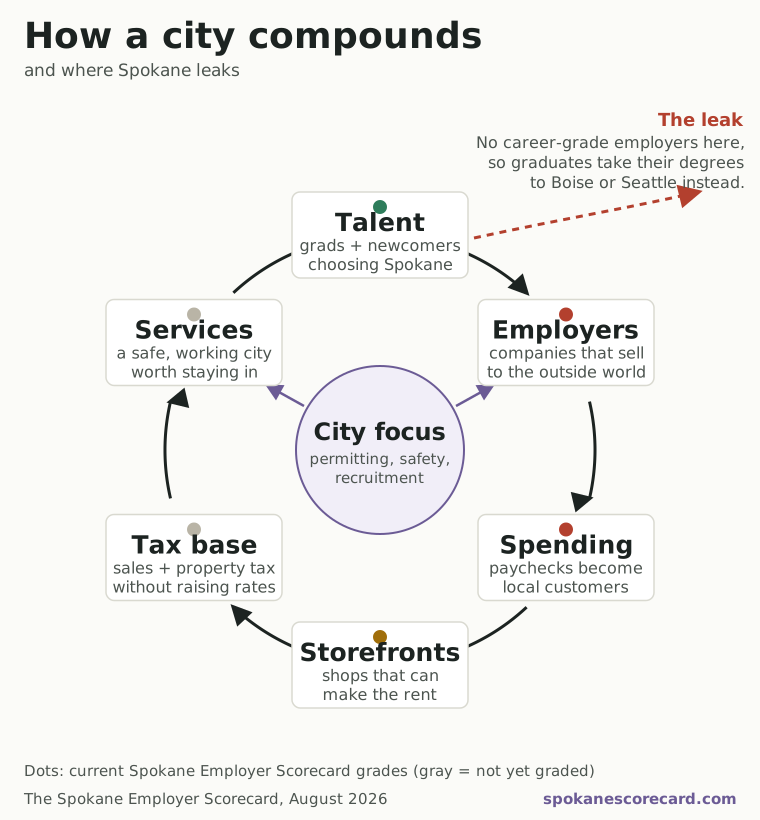
Everything on this page is one machine. Schools and new arrivals supply workers. Employers turn workers into paychecks. Paychecks become customers. Customers fill storefronts and pay taxes. Those taxes fund the services that make people and companies want to stay. Each turn makes the next one easier. Unless a gear is missing.
The dots are Spokane’s current grades from the measures above. Green where people enter the wheel, red exactly where the employers should be, and the red bleeding downstream. The region’s challenge isn’t to spin every gear. It’s to fix the one that’s missing, and city hall’s part is to pull its own levers toward it.
If you live here, you’ve seen the puzzle pieces without the box top. Ground-floor spaces sit empty on Monroe while apartments rise around them. New commercial construction has slowed to a trickle. Help-wanted signs everywhere, yet the higher-wage jobs always seem to be somewhere else.
None of it is random. Storefronts stay dark because spending in the city is growing at a quarter of its normal pace. Spending lags because the region shed jobs this year, and the jobs it is creating cluster in one sector. And when wage-raising employers are scarce, talented people commute, take remote jobs with out-of-town firms, or leave for cities that have them. The eight measures above are that story, counted. The employer calculator lets you test the way out for yourself.
Here is the idea this whole page turns on. Some employers sell to people outside the region: software sold nationally, goods shipped out, patients driving in from Idaho. Their sales pull new money into Spokane. Other employers, like shops and restaurants, mostly pass around money that is already here. A city needs both. But only the first kind makes the pot bigger.
And each new paycheck does not stop with the person who earns it. They spend it at local shops, clinics and restaurants, and that spending pays other people’s wages. Economists call this the local multiplier. This page calls it the ripple, and it is bigger for some employers than others:
Illustrative multiplier range, not a Spokane forecast
Same 500 hires. Very different ripple. The solid block is the direct jobs. The hatched stretch is the range of extra local jobs those paychecks could support, drawn as a range on purpose: it is an estimate from published research, not a forecast.
Show these numbers as a table
The same 500 jobs in two industries
Employer
Extra local jobs
Total effect
Software & tech
900 to 1,900
1,400 to 2,400
Retail & food service
0 to 100
500 to 600
The ranges come from published research on local multipliers (Moretti, capped downward per Bartik and the Upjohn Institute). They are widened on purpose.
Try it yourself
extra local jobs created
total jobs, direct plus ripple
new annual payroll
new local spending per year
storefronts that spending could sustain
How to read the chart: the bottom axis counts jobs hired. The height shows the extra local jobs those hires could support, from the low estimate to the high one. The dashed line is your pick. One scale for every sector, so a flat wedge really is flat. One more marker: the top of this slider, 5,000 jobs, equals Believe Spokane’s whole five-year goal for the region. Same math and sources as the full calculator, which compares two employers side by side.
Outside money and local money do different jobs
Both sides are real jobs and real paychecks. Neither is worth more than the other. The difference is that the left side grows the pot, and the right side circulates it. A region needs both, but only one of them makes the pot bigger.
Greater Spokane Inc.’s Believe Spokane campaign set these five-year goals when it launched in March 2023. The clock runs through 2028. As of this edition, the campaign is about three and a half years in, with about a year and a half to go. GSI posts updates against the goals.
5,000new jobs
$1Bnew capital investment
300internships with local employers
5,000students given career pathway experiences
So how is the region doing?
The money side is public. Partners pledged just over $3 million to fund the campaign, ahead of schedule (Journal of Business, 2023). The results side is harder to check. GSI’s 2024 and 2025 updates describe the work, but they do not publish running totals for the four numbers above. So this page cannot verify progress toward them, and it will not guess. The day a running tally is published, it gets linked here.
What can be checked is the region itself. That is the whole job of this page. The eight measures above track whether the region is getting there. Greater Spokane Inc. runs the plays. This is the scoreboard, kept by somebody who is not running them.
Which actors hold levers on which published targets
A dot means that actor holds a lever on that target. Tap an actor to open its detail below. Nobody owns the whole economy; different institutions own different levers.
No single office controls those eight numbers. So here is the machine with name tags: each actor, the levers only it holds, and where things stand. Open any row for the detail. Every status line is tied to a measure, tied to a source, or stated as an open question, and open questions are invitations: send the data and it gets linked.
Six actors, one economy. None of them moves those eight numbers alone. Open any one below for the levers it actually holds and where things stand.
City of SpokanePermits · land · fees · downtownNot scored yet
How fast permits move, and how predictable they are. Zoning that keeps land ready for employers to build on. Downtown safety. What businesses pay in fees. Where the council spends its time.
Not scored yetThe city has an economic development chapter in its comprehensive plan, with living-wage language and target investment areas. What it does not publish is measurable progress. Later editions aim to score things the city controls outright. How long a permit takes. Whether zoned land is ready to build on. What businesses pay in fees.
The regional recruitersRecruiting · sites · incentivesGoals published
Spokane County and Greater Spokane Inc. run the actual sales effort. They pick the target industries, get sites ready, line up incentives, and make the pitch employers hear.
Goals publishedGSI’s Believe Spokane campaign sets public five-year goals, including 5,000 jobs and $1 billion in new capital investment, and posts progress updates. GSI also runs a public regional indicators dashboard. The plan is not the open question. Progress against it is.
Higher educationTalent · internships · researchPartly published
Gonzaga, Whitworth, EWU, WSU Spokane, the UW and GU medical partnership, and the community colleges. They decide how many graduates come out, and in which fields. They also decide whether students intern at local firms, and whether research here turns into companies.
Partly publishedGonzaga publishes a First Destination dashboard you can filter by major and by location. Whitworth publishes graduate outcomes too. Nursing retention is reported and strong. What the region lacks is one comparable number across all the schools.
Anchor employersExpansion · hiring · suppliersRegional signal weak
Itron, Kaiser Aluminum, Providence, MultiCare, Avista and others. They hold the choice Boise teaches: grow here, or grow somewhere else. They also decide how many interns they take and which local suppliers they build up.
Regional signal weakThis grade describes the region, not any one company. Traded-sector hiring across Spokane is weak. That is not a mark against any employer who is investing here. What no one outside can see is which local anchors are adding payroll and capital, because that is not published.
The state of WashingtonTaxes · incentives · infrastructureUpstream, not graded
Taxes, incentives, roads and other infrastructure, and college funding east of the Cascades. Also the minimum wage, which already pushed Spokane’s hourly pay close to the national average.
Upstream, not gradedThis is the biggest lever on the board and the one furthest from Spokane. Tax structure, incentives, infrastructure money and higher-education funding east of the Cascades are all set in Olympia. This page grades regional outcomes rather than state policy, but a scorecard that pretended the state was a footnote would be lying about how the machine works.
Residents, including this pageVotes · attention · correctionsYours
Attention, votes, meeting rooms, and corrections. On track looks like showing up when the levers above get discussed.
You’re reading the lever.
The longer version, including what city hall does and doesn’t control
No mayor lands a factory alone, and this page does not pretend otherwise. Landing employers runs through Greater Spokane Inc., the county, the state, and forces nobody here controls. But the city does hold real levers. How fast and how predictably it issues permits. Whether land zoned for employers can actually be built on. Whether downtown feels safe enough to bring workers back. What it charges a business to operate. And where the council spends its time.
The grades above measure the region’s results. The question for city hall is simpler: are your levers pulled toward these numbers, or toward something else?
On higher education, here is the detail. The number is published where the story is strong. SCC reports that 99% of its nursing graduates stay in the Spokane area. Gonzaga and EWU report similar strength in nursing. For engineering, computing and business, the fields the missing employers hire from, no local school publishes how many graduates stay, as far as this page can find. There is a regional number called “retention,” but it tracks whether students stay enrolled, not whether graduates stay in town. The first school to publish this by program gets celebrated at the top of this page.
On big local employers. Cheap power is already drawing interest from data centers, which shows the pull is real. The question is whether it turns into employers who hire a lot of people.
Different sizes and different advantages. None of them is Spokane’s twin. The pattern is what carries over. Each city picked an asset it already had, organized around it, and stuck with it for a decade.
BoiseGrew its own anchor
Asset
Micron
Move
Help the anchor expand at home
Result
$15B grew to roughly $50B
Idaho helped a company already there grow at home. Micron is building advanced memory plants at its Boise headquarters, an investment that grew from $15 billion to roughly $50 billion, with about 17,000 Idaho jobs tied to it. Keeping a company is its own kind of recruiting.
Spokane’s version: the big employers already here, like Itron and Kaiser Aluminum. Their next expansion has to want to happen here.
Chattanooga landed a $1 billion Volkswagen plant in 2008, and a University of Tennessee study found it beat its own job forecasts, with more than 12,400 direct and indirect jobs by 2012. The city also built the country’s first citywide gigabit network, a concrete reason for employers to look.
Spokane’s version: cheap, reliable power. It is already drawing interest from data centers. The job is turning that interest into employers who hire a lot of people, not just server halls.
Redstone Arsenal employs more than 42,000 people and drives half the metro economy. The region kept selling that asset until the FBI made Redstone its unofficial second headquarters, with Space Command following.
Spokane’s version: Fairchild Air Force Base, and a health sciences campus with two medical schools. Today neither is used as a way to draw employers.
The answer to “aren’t we too dependent on health care?” After steel collapsed, leaders rebuilt on purpose around universities and hospitals, and Carnegie Mellon’s research grew into the country’s largest cluster of robotics work, more than 80 companies along two miles.
Two caveats: Pittsburgh is several times Spokane’s size, and the turnaround took decades. The lesson holds anyway. An eds-and-meds economy can be a launchpad if research becomes companies.
Spokane’s version: two medical schools and a health sciences campus. They could seed medical technology the way Carnegie Mellon seeded robotics.
For decades, rail yards and trestles covered Havermale Island and blocked downtown from its own falls. In 1974 Spokane tore them out and hosted a world’s fair on the site, the first with an environmental theme. When the fair closed, the grounds became Riverfront Park.
The clock tower is what was kept. It is the last piece of the 1902 Great Northern depot, whose yards covered the ground it now stands on.
This does not prove Spokane can land wage-raising employers. It proves something smaller and sturdier: this city can pick a long, unglamorous project and finish it. That is the muscle the employer problem needs. Nobody calls it lucky now. They call it Riverfront Park.
The pattern across all four: a named asset, a public plan, and years of unglamorous follow-through. Nothing on that list requires luck, size, or a coastline. And Spokane has run the play before.
So here is what this page asks of the people who hold the levers here. The three asks ↓
Part 6 · The asks
What this page asks
Nobody controls the whole economy, so each ask goes to the people who hold that one lever. None of them costs much. All of them can be checked later, which is the point.
City leaders
1
Adopt a scoreboard.
These eight measures or better ones. Report against them in public, on a schedule, the way the city already reports on potholes and permits.
2
Publish progress against the plan.
The plans exist. GSI has published five-year goals. The city has an economic development chapter in its comprehensive plan. What is missing is a short public scoreboard showing progress against them, updated on a schedule, in one place a resident can find.
3
Explain the tradeoffs.
Most city business has nothing to do with attracting employers, and shouldn’t. But when major money and attention get allocated, say out loud what each choice does for the numbers on this page. Name what is being traded away, not just what is being bought.
Colleges
Publish one comparable number.
Some of you already do a version of this. Gonzaga has a public dashboard you can filter by major and by location, and Whitworth publishes outcomes too. Credit where it is due.
What the region still lacks is one number that means the same thing at every school: the share of graduates in a given field working in the Spokane area a year out. Right now the reports are not comparable, so nobody can add them up.
And to be clear about what this measures. If a school produces 200 engineers and 150 leave, that is not the school failing. It is evidence the region does not have jobs for them. Graduate retention is a diagnostic for the employer ecosystem, not a grade on any university.
Washington State
Publish which county graduates work in.
Washington already links school records to paycheck records. The state’s Earnings for Graduates dashboard shows what graduates earn, broken out by school and by major, using unemployment insurance wage records. What it does not show is where those graduates work. It only says “somewhere in Washington.”
The employer’s location is already sitting in those records. Adding county of employment is a different cut of a report that already exists. It is not a new survey. It would answer this for every school in the state at once, in weeks rather than years.
It would also have a known blind spot, and that is worth saying out loud. It would catch graduates who leave Spokane for Seattle, because Seattle is in Washington. It would miss the ones who leave for Boise or Denver. That is still far more than anyone can see today.
Spokane residents
You do not have to run anything to help.
Share this page with one person who cares about Spokane. Check the numbers when a new edition posts. And when a good employer wants to build here, show up and say so. Public support is a lever too, and it is the one everyone holds.
Spokane shows up. The watch party crowd at the Pavilion in Riverfront Park for a 2026 World Cup match, June 2026. Photo: T85cr1ft19m1n, CC0, via Wikimedia Commons.
Want to know whether any of this moves?
New grades post every quarter, with a note on what changed. Four emails a year, nothing else.
And a commitment back: this scorecard is not rooting for anyone to fail. The quarter these numbers improve, the top of this page will say so, in green, with credit to whoever moved them.
Skepticism is the right response to a scorecard. These are the best objections, taken in their strongest form.
What about taxes?
In Greater Spokane Inc.’s April 2026 poll, 68% of Spokane-area voters said they had actively considered moving away, and taxes topped their stated reasons. Jobs did not make the list. That finding cuts against this page’s argument, so it gets a straight answer rather than a footnote.
Open the poll, the tax data, and the answer
Greater Spokane Inc. polls Spokane-area voters every few months. In April 2026 it found that 68% had actively considered moving out of the area. When it asked them why, jobs and wages did not make the list at all.
Taxes21%
Government leadership19%
Cost of living17%
Public safety13%
Homelessness7%
Reasons given by the 395 respondents who had considered leaving. GSI’s Pulse, fourth edition, 600 voters across the city, the valley and the county, April 2026.
That is a real finding from a real poll, run by the region’s own economic development group. It is also not the argument this page makes. So which one is right?
Both. It is the same squeeze from opposite ends.
A tax bill is not a fixed weight. It is a share of what you earn. The same property tax is an irritation at one income and a reason to leave at another.
Washington makes that gap unusually wide. The Institute on Taxation and Economic Policy ranks this state 49th out of 50 for how much more of their income lower earners hand over than higher earners do.
13.8%of income paid in state and local taxes by the poorest fifth of Washington households
4.1%paid by the wealthiest 1%, households earning over $848,400
Now set that next to the Incomes measure above. Spokane earns about 80 cents for every dollar of income in Washington. The tax structure here is the same one they have in Bellevue. The paychecks are not.
So when a Spokane voter says taxes and this page says wages, both are pointing at the same squeeze from opposite ends. You can loosen it by lowering what people pay, or by raising what they earn. This page is about the second one, because it is the one that compounds.
Three things to be careful about in this section
These tax numbers are for Washington as a whole. There is no Spokane version of them, and this page will not invent one. The claim here is structural: this state takes a bigger share from lower earners, and Spokane earns less than the state average.
Washington is getting less regressive, not more. It moved off last place in 2024, after the Working Families Tax Credit and the capital gains tax. That is real progress and it belongs on the record.
The poll asked voters, not residents. Voters skew older and more settled than the young people deciding whether to start a career here. Their reasons are worth knowing. They are not the whole picture.
Isn’t unemployment low? That sounds like good news.
It is low, 3.8% in June 2026, and it stays on the board. But the rate only counts people actively looking, and Spokane’s labor force participation lags the national rate. A low rate over a shrinking pool is a mixed signal, not a green one. The full picture is in the unemployment measure.
Isn’t health care growth good?
Yes. Health care is essential work, and Spokane’s referral-hub role brings outside money in. The concern is concentration, not quality: more than one in five county jobs is now in one sector, and leaning that hard on any single sector is a risk. The chart is in the hiring measure.
How much of this can City Hall actually control?
A minority of it, and this page says so. The grades measure regional results that no office controls alone. What the city does control outright is in the plan: permitting speed, land readiness, fees, and downtown conditions.
People keep moving here. Doesn’t that mean Spokane is succeeding?
It is the region’s strongest card, and it is graded strong. It is also perishable: people who arrive and cannot find work that pays eventually leave for it. Population is the engine working. The employer engine is the one this page watches.
Every number above links to its source. The full methodology covers the grading rules, the limits of the data, and what it can and cannot tell you. Corrections are welcome, and they get posted.
How the grades work
Strong means Spokane beats its benchmark (the U.S. or Washington) or is clearly improving. Mixed means near benchmark or mixed signals. Weak means below benchmark and not improving. Grades are judgment calls made in public: every number links to its source, and corrections are welcome and will be posted.
The call at the top follows a rule set before looking at the data. Off track when weak measures outnumber strong ones. Mixed when they tie. On track when strong ones win. There is no letter grade, on purpose. The eight measures are not equally important, and they are not independent of each other. Averaging them would suggest a precision this data does not have.
Unless a card says otherwise, the data covers Spokane County or the Spokane metro. That is the level where reliable public job data exists. Updated by hand, every quarter.
Coming in future updates
Measures worth adding, once the data can be had:
New business applications per resident (Census Business Formation Statistics).
How long the city takes to turn around a permit. The city controls this one outright.
Empty storefronts street by street. Monroe, Garland and Division would each get their own line, instead of being averaged away.
Whether land zoned for employers is actually ready to build on.
What the city charges a business to operate.
Big employer expansions kept or won.
One more arrives only when schools publish it: where graduates go, by school and program.
The next test
November is the next test
All eight measures get re-graded in November 2026, from the fall releases: fresh jobs and unemployment numbers, new retail spending and vacancy figures, and the Census Bureau’s new income estimates.
The bar is already set, in public. One weak measure turning strong, or two turning mixed, moves the region to the middle. How the call works. And when a grade improves, it gets said at the top of this page, in green, with credit to whoever moved it.